TensorFlowで学ぶディープラーニング入門備忘録【第2章】

TensorFlowで学ぶディープラーニング入門 ~畳み込みニューラルネットワーク徹底解説~
- 作者: 中井悦司
- 出版社/メーカー: マイナビ出版
- 発売日: 2016/09/27
- メディア: 単行本(ソフトカバー)
- この商品を含むブログを見る
第1章からの続きになる。
2.1 ロジスティック回帰による二項分類器
2.1.1 確率を用いた誤差の評価
第1章でも論じた、与えられたデータをウイルスに感染している・していないに分類する二項分類器(パーセプトロン)のモデルを取り上げる。ただし、単純に2種類に分類するのではなく、確率を用いてすすめる。第1章でも論じたように、検査結果(x1,x2)に対して、ウイルスに感染している確率は、
で表される。ここで、仮にパラメータw0,w1,w2が具体的に決まっているとして、最初に与えられたデータを改めて予測し直してみる。まず、与えられたデータは全部でN個あるものとして、n番目のデータを(x1n,x2n)とする。またデータが実際に感染している場合、tn=1、感染していない場合、tn=0とする。n番目のデータが感染している確率はP(x1n,x2n)で与えられるので、この確率に応じて感染していると予測する。0〜1の間で乱数を発生させて、P(x1n,x2n)以下であれば感染している、と予測することにする。
この方法で予測した場合、正解する確率はどれほどだろうか。tn=1のとき、つまり実際に感染しているときに感染していると予測する確率はP(x1n,x2n)そのものなので、これが正解する確率に一致する。一方、tn=0、つまり実際には感染していない場合、感染していないと正しく予測する確率は1-P(x1n,x2n)になる。これは、以下の数式で一度に書ける。
そしてN個のデータ全てに正解する確率Pは、個々のデータを正解する確率の掛け算で計算することができ、
あるいは、
と書ける。この確率がパラメータw0,w1,w2を評価する基準になる。このように「与えられたデータを正しく予測する確率を最大化する」手法は最尤(さいゆう)推定法と呼ばれる。これでパラメータの良し悪しを判断する基準、すなわち「機械学習モデルの3ステップ」のステップ2が用意できた。TensorFlowで計算する場合、式(2.6)のような掛け算を大量に含む演算は効率が良くないので、次式で誤差関数Eを定義する。
これでPを最大にすることと、-logPを最小にすることが同値になった。 (2.6)を(2.7)に代入し、変形すると、誤差関数Eは
と表される。
2.1.2 TensorFlowによる最尤推定の実施
TensorFlowでこれまでの数式を表現する。まずはモジュールのインポートを以下で行う。
import tensorflow as tf
import numpy as np
import matplotlib.pyplot as plt
from numpy.random import multivariate_normal, permutation
import pandas as pd
from pandas import DataFrame, Series
次に行うのが、トレーニングセットのデータの用意だ。
#乱数のシードを決める。20160512という数字に意味はない。同じ数字を指定すると、毎回同じデータが生成される。
np.random.seed(20160512)

#t=0(非感染)のデータを乱数で発生
n0, mu0, variance0 = 20, [10, 11], 20
data0 = multivariate_normal(mu0, np.eye(2)*variance0 ,n0)
df0 = DataFrame(data0, columns=['x1','x2'])
df0['t'] = 0

#t=1(感染)のデータを乱数で発生
n1, mu1, variance1 = 15, [18, 20], 22
data1 = multivariate_normal(mu1, np.eye(2)*variance1 ,n1)
df1 = DataFrame(data1, columns=['x1','x2'])
df1['t'] = 1

#データを一つにまとめ、行の順番をランダムに入れ替え
df = pd.concat([df0, df1], ignore_index=True)
train_set = df.reindex(permutation(df.index)).reset_index(drop=True)
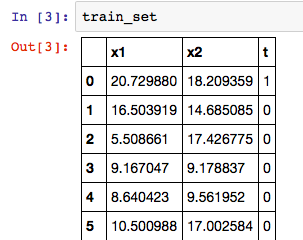
これで、データセットが整った。Jupyterのノートブック上で、データフレームの内容は以下コマンドから表で確認できる。
train_set

ただしTensorFlowで計算する際は各種のデータを多次元配列で表現する必要があった。そこで、(x1n,x2n)とtnをn=1〜Nについて縦に並べた行列を次のように定義する。
トレーニングセットに含まれるそれぞれのデータを(2.1)のf(x1,x2)に代入した結果は次のように表現できる。
これをさらにシグモイド関数に代入したものが、n番目のデータがt=1である確率Pnになる。
ここまでをTensorFlowのコードで表現する。
#train_setに対応するデータをarrayオブジェクトとして変数train_xとtrain_tに格納する
train_x = train_set[['x1','x2']].as_matrix()
train_t = train_set['t'].as_matrix().reshape([len(train_set), 1])
#
x = tf.placeholder(tf.float32, [None, 2])
w = tf.Variable(tf.zeros([2, 1]))
w0 = tf.Variable(tf.zeros([1]))
#tf.matmul(x,w)とw0は本来足し合わせられないが、下述のブロードキャストルールが適用される。
f = tf.matmul(x, w) + w0
p = tf.sigmoid(f)
TensorFlowのリスト演算における特別なルールで、多次元リストに1要素からなる値を足した場合、リストの各要素に同じ値が足される。
・行列とスカラーの足し算は、各成分に対する足し算になる
・同じサイズの行列の*演算は、成分ごとの掛け算になる
・スカラーを受け取る関数を行列に適用すると、各成分に関数が適用される
続いて、誤差関数をTensorFlowのコードで表現し、これを最小化するためのトレーニングアルゴリズムを指定する。これは、式(2.9)で与えられており、次のようになる。
t = tf.placeholder(tf.float32, [None, 1])
loss = -tf.reduce_sum(t*tf.log(p) + (1-t)*tf.log(1-p))
train_step = tf.train.AdamOptimizer().minimize(loss)
さらに、正解率を表す計算値を定義する。仮に、n番目のデータに対して、Pn>0.5であればt=1、そうでなければt=0とし、正解率がいくらになるかを計算する。
#(Pn-0.5)と(tn-0.5)の符号を比較し、予測が正解かを判定。signは符号を取り出す関数。
correct_prediction = tf.equal(tf.sign(p-0.5), tf.sign(t-0.5))
#tf.cast関数でbooleanを1,0に変換し、全体の平均値を計算する。
accuracy = tf.reduce_mean(tf.cast(correct_prediction, tf.float32))
実際の最適化に入る。
#セッションを用意し、Variableの値を初期化
sess = tf.Session()
sess.run(tf.initialize_all_variables())
#勾配降下法による最適化を20000回繰り返す。
i = 0
for _ in range(20000):
    i += 1
    sess.run(train_step, feed_dict={x:train_x, t:train_t})
    if i % 2000 == 0:
        loss_val, acc_val = sess.run(
            [loss, accuracy], feed_dict={x:train_x, t:train_t})
        print ('Step: %d, Loss: %f, Accuracy: %f'
               % (i, loss_val, acc_val))
これを行うと、誤差関数lossと正解率accuracyの値が表示される。
Step: 2000, Loss: 15.165894, Accuracy: 0.885714
Step: 4000, Loss: 10.772635, Accuracy: 0.914286
Step: 6000, Loss: 8.197757, Accuracy: 0.971429
Step: 8000, Loss: 6.576121, Accuracy: 0.971429
Step: 10000, Loss: 5.511973, Accuracy: 0.942857
Step: 12000, Loss: 4.798011, Accuracy: 0.942857
Step: 14000, Loss: 4.314180, Accuracy: 0.942857
Step: 16000, Loss: 3.986264, Accuracy: 0.942857
Step: 18000, Loss: 3.766511, Accuracy: 0.942857
Step: 20000, Loss: 3.623064, Accuracy: 0.942857
最適化を打ち切り、この時点でのパラメータの値を取得する。
w0_val, w_val = sess.run([w0, w])
w0_val, w1_val, w2_val = w0_val[0], w_val[0][0], w_val[1][0]
print w0_val, w1_val, w2_val
最後に、取り出した値を用いて、結果をグラフに表示する。
train_set0 = train_set[train_set['t']==0]
train_set1 = train_set[train_set['t']==1]

fig = plt.figure(figsize=(6,6))
subplot = fig.add_subplot(1,1,1)
subplot.set_ylim([0,30])
subplot.set_xlim([0,30])
subplot.scatter(train_set1.x1, train_set1.x2, marker='x')
subplot.scatter(train_set0.x1, train_set0.x2, marker='o')

linex = np.linspace(0,30,10)
liney = - (w1_val*linex/w2_val + w0_val/w2_val)
subplot.plot(linex, liney)

field = [[(1 / (1 + np.exp(-(w0_val + w1_val*x1 + w2_val*x2))))
          for x1 in np.linspace(0,30,100)]
         for x2 in np.linspace(0,30,100)]
subplot.imshow(field, origin='lower', extent=(0,30,0,30),
               cmap=plt.cm.gray_r, alpha=0.5)

ここでは、グラフ上の色の濃淡が確率P(x1,x2)の値の大きさに対応しており、シグモイド関数が表現されていることが分かる。シグモイド関数
はロジスティック関数とも呼ばれており、ここで用いた分析手法はロジスティック回帰と呼ばれる。
2.1.3 テストセットを用いた検証
ここまでで、与えられたデータを正確に予想することを行ってきたが、本来の目的は未知のデータに対して予測の精度を上げることである。特にトレーニングセット(学習用データ)に対する正解率が非常に高いのにも関わらず、未知のデータに対する予測精度はあまり良くない現象を過学習もしくはオーバーフィッティングと呼ぶ。これを避けるためによく行われるのが、あえて一部のデータをテスト用に取り分ける方法だ。例えば、80%のデータで学習を行いながら、残りの20%のデータに対する正解率の変化を見ていくのだ。
そこで、これから今までのコードを修正し、トレーニングセットとテストセットのそれぞれに対する正解率の変化を確認する。
まず、乱数でデータを作成したあと、80%をトレーニングセットのデータ用、20%をテストセットのデータとして取り分ける。
#インポートと乱数シードの設定
import tensorflow as tf
import numpy as np
import matplotlib.pyplot as plt
from numpy.random import multivariate_normal, permutation
import pandas as pd
from pandas import DataFrame, Series

np.random.seed(20160531)

#80%をトレーニング用、20%をテスト用として取り分け
n0, mu0, variance0 = 800, [10, 11], 20
data0 = multivariate_normal(mu0, np.eye(2)*variance0 ,n0)
df0 = DataFrame(data0, columns=['x','y'])
df0['t'] = 0

n1, mu1, variance1 = 600, [18, 20], 22
data1 = multivariate_normal(mu1, np.eye(2)*variance1 ,n1)
df1 = DataFrame(data1, columns=['x','y'])
df1['t'] = 1

df = pd.concat([df0, df1], ignore_index=True)
df = df.reindex(permutation(df.index)).reset_index(drop=True)

num_data = int(len(df)*0.8)
train_set = df[:num_data]
test_set = df[num_data:]

#トレーニングセット用、テスト用の変数に格納
train_x = train_set[['x','y']].as_matrix()
train_t = train_set['t'].as_matrix().reshape([len(train_set), 1])
test_x = test_set[['x','y']].as_matrix()
test_t = test_set['t'].as_matrix().reshape([len(test_set), 1])

#各種計算式定義
x = tf.placeholder(tf.float32, [None, 2])
w = tf.Variable(tf.zeros([2, 1]))
w0 = tf.Variable(tf.zeros([1]))
f = tf.matmul(x, w) + w0
p = tf.sigmoid(f)

t = tf.placeholder(tf.float32, [None, 1])
loss = -tf.reduce_sum(t*tf.log(p) + (1-t)*tf.log(1-p))
train_step = tf.train.AdamOptimizer().minimize(loss)

correct_prediction = tf.equal(tf.sign(p-0.5), tf.sign(t-0.5))
accuracy = tf.reduce_mean(tf.cast(correct_prediction, tf.float32))

#セッションを用意
sess = tf.Session()
sess.run(tf.initialize_all_variables())

#勾配降下法を繰り返し、トレーニングセットとテストセットに対する正解率の変化を記録
train_accuracy = []
test_accuracy = []
for _ in range(2500):
    sess.run(train_step, feed_dict={x:train_x, t:train_t})
    acc_val = sess.run(accuracy, feed_dict={x:train_x, t:train_t})
    train_accuracy.append(acc_val)
    acc_val = sess.run(accuracy, feed_dict={x:test_x, t:test_t})
    test_accuracy.append(acc_val)

#結果をグラフに表示する
fig = plt.figure(figsize=(8,6))
subplot = fig.add_subplot(1,1,1)
subplot.plot(range(len(train_accuracy)), train_accuracy,
             linewidth=2, label='Training set')
subplot.plot(range(len(test_accuracy)), test_accuracy,
             linewidth=2, label='Test set')
subplot.legend(loc='upper left')

上図を見ると、勾配降下法の試行回数に従い正解率が上昇していることが分かるが、トレーニングセットとテストセットで正解率が一致していないことが分かる。オーバーフィッティングが発生した場合、トレーニングセットよりも先に、テストセットに対する正解率が増加しなくなる。
2.2 ソフトマックス関数と多項分類器
2.1ではロジスティック回帰を用いて、平面上のデータを2種類に分類する二項分類器(パーセプトロン)を試した。ここからは、データを3種類以上に分類する多項分類器と分類結果を確率で表現するソフトマックス関数を取り扱う。
2.2.1 線形多項分類器の仕組み
はじめに、(x1,x2)平面を3つの領域に分割することを考える。
2分割のときf(x1,x2)=0なる関数で定義する直線が平面を2分割できた。z軸を加えると、z=0で決まる平面で、(x1,x2)平面が上下に2分割される事がわかる。ここで、次の3つの関数を用意し、それを3次元空間に描くことを考えると、異なる方向に傾いた2平面は1本の直線で交わり、3平面は1点で交わることが分かる。結果、どの平面が一番上になっているかで、(x1,x2)平面を3領域に分割することが可能になる。
3つの平面が交わる点(x1,x2)は
の解となる点で、行列式を用いて、
ただし、
したがって、解はMの逆行列を解いて、
となる。以上から、w01,w11,w21,w02,w12,w22,w03,w13,w23を調整することにより、(x1,x2)平面を3つの領域に分割できる事がわかる。このように1次関数を用いて直線的に領域を分割する仕組みを線形多項分類器と呼ぶ。
2.2.2 ソフトマックス関数による確率への変換
2.1.1ではf(x1,x2)の値をシグモイド関数を用いて確率Pに変換していた。一方、ここでは次の3つの確率を割り当てることが目標となる。
- P1(x1,x2): (x1,x2)が領域1に属する確率
- P2(x1,x2): (x1,x2)が領域2に属する確率
- P3(x1,x2): (x1,x2)が領域3に属する確率
これは例えば、手書きの文字が「あ」である確率、「い」である確率、「う」で確率に計算される状況を考えれば良い。 これらの確率は次の3式を満たす必要がある。
そして、これらを満たす式がソフトマックス関数と呼ばれ、次式で表される。
以上の話をより一般化して書くと、座標(x1,x2,...,xM)を持つM次元空間をK個の領域に分割する場合、まず全部でK個の1次関数を用意する。
そして、点(x1,x2,...,xM)がk番目の領域である確率はソフトマックス関数を用いて、次式で表される。
2.3 多項分類器による手書き文字の分類
ここからは前節の多項分類器を使って、手書き文字の分類問題を解いていく。
2.3.1 MNISTデータセットの利用方法
MNISTというデータセットを用いる。このデータセットにはトレーニング用の55000個のデータとテスト用の10000個のデータ、検証用の5000個のデータからなる。TensorFlowにはMNISTのデータセットをダウンロードしてNumPyのarrayオブジェクトとして格納するモジュールが予め用意されている。
#モジュールのインポート
import numpy as np
import matplotlib.pyplot as plt
from tensorflow.examples.tutorials.mnist import input_data

#MNISTデータセットのダウンロード
mnist = input_data.read_data_sets("/tmp/data/", one_hot=True)

#10個のデータを取り出し、画像データとラベルの変数に格納
images, labels = mnist.train.next_batch(10)
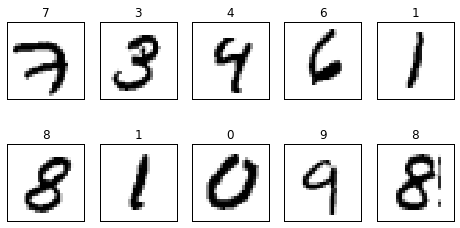
ここまでで、MNISTのデータ10個を変数に格納できた。対応するラベルを次に表示してみよう。
#対応するラベルのデータを表示してみる
print labels[0]
[ 0. 0. 0. 0. 0. 0. 0. 1. 0. 0.]
これを見ると、先頭から7番目の要素が1になっている。これはこの画像が「7」であることを表す。このように機械学習のデータセットではデータを幾つかのグループに分類する際に、k番目の要素のみが1になっているベクトルでk番目のグループであることを示す場合がある。これを1-of-Kベクトルを用いたラベル付けと呼ぶ。
#取り出した10個のデータの画像を表示してみる
fig = plt.figure(figsize=(8,4))
for c, (image, label) in enumerate(zip(images, labels)):
    subplot = fig.add_subplot(2,5,c+1)
    subplot.set_xticks([])
    subplot.set_yticks([])
    subplot.set_title('%d' % np.argmax(label))
    subplot.imshow(image.reshape((28,28)), vmin=0, vmax=1,
                   cmap=plt.cm.gray_r, interpolation="nearest")
表示される画像は以下のようになる。

2.3.2 画像データの分類アルゴリズム
上の画像データに対して、多項分類器による分類手法を適用していく。 先程の画像は28×28ピクセルの画像だ。これは28×28=784個の数値、784次元空間の1つの点(x1,x2,...,x784)に対応することになる。この時、同じ数字に対応する画像は784次元空間上で互いに近い場所に集まっていると考えられる。そのため、個のデータを784次元空間上でどの領域に属するかによって、どの数字の画像かを予測することが可能となる。
まず784次元空間のデータを0〜9の10種類の領域に分割するので、M=784、K=10としておく。そして、トレーニングセットのデータが全部でN個あるものとして、n番目のデータをxn=(x1n,x2n,...,xMn)と表し、さらにこれらを並べた行列Xを定義する。
次に、(2.25)式の1次関数の係数を並べた行列W、および定数項を並べたベクトルwを次式で定義する。
これらから(2.25)は
とまとめて計算される。
続いて、(2.26)のソフトマトリックス関数を使って、確率の値に変換する。今回は、n番目のデータxnに対して、これがk=1,...,Kのそれぞれに属する確率Pk(xn)を計算する。
tensorflowではこれをきちんと行列演算で行ってくれる関数tf.nn.softmaxが用意されていて、
で求められる。これで、与えられた画像データに対してそれが0から9のいずれかである確率を計算するための数式が用意できた。新しいデータx=(x1,x2,...,xM)に対する確率を計算する際は(2.27)のXを次の1xM行列として用意する。
これを用いて、(2.29)と(2.33)の計算を行うと、Pは次の1xM行列になることが分かる。
tensorflowのコードで言うと、xはPlaceholderに相当する。 次に、誤差関数を用意する。これには最尤推定法を用いる。たとえば、n番目のデータxnの正解がkだった場合、正解を予測する確率はPk(xn)ということになる。ここで、一般にtn=(t1n,t2n,...,tKn)と表すと、n番目のデータに対して、正解を予測する確率Pnは
また、すべてのデータに対して正解する確率Pは個々のデータに正解する確率の掛け算で決まる、
このあとは(2.7)と同じく、誤差関数Eを最小化するために、確率Pを最大化する。
これは対数関数の公式より、
と書き直せる。この誤差関数Eを行列形式で表すためにはブロードキャストルールとTensorFlowのtf.reduce_sum関数を利用する。結局誤差関数Eは
と表せる。いよいよTensorFlowのコードに入っていく。
#MNISTのデータセットを取得するモジュールをインポート
import tensorflow as tf
import numpy as np
import matplotlib.pyplot as plt
from tensorflow.examples.tutorials.mnist import input_data

np.random.seed(20160604)

#MNISTのデータセットをダウンロード
mnist = input_data.read_data_sets("/tmp/data/", one_hot=True)

#トレーニングセットのデータに対して、領域に属する確率Pk(xn)を計算する数式を定義
#xの要素数784は画像のピクセル数に一致して28x28=784
x = tf.placeholder(tf.float32, [None, 784])
w = tf.Variable(tf.zeros([784, 10]))
w0 = tf.Variable(tf.zeros([10]))
f = tf.matmul(x, w) + w0
p = tf.nn.softmax(f)

#誤差関数Eの定義
t = tf.placeholder(tf.float32, [None, 10])
loss = -tf.reduce_sum(t * tf.log(p))
train_step = tf.train.AdamOptimizer().minimize(loss)

#正解率を表す関係式の定義
#tf.argmaxは複数の要素が並んだリストから最大値を持つ要素のインデックスを返す関数。
#確率Pkのなかでも最大の確率となる文字がラベルで指定された正解の文字と一致するかを確認している
correct_prediction = tf.equal(tf.argmax(p, 1), tf.argmax(t, 1))
accuracy = tf.reduce_mean(tf.cast(correct_prediction, tf.float32))

#セッションを準備する
sess = tf.InteractiveSession()
sess.run(tf.initialize_all_variables())

#勾配降下法によるパラメータの最適化を実施する
i = 0
for _ in range(2000):
    i += 1
#トレーニングセットから100個のデータを取り出す
    batch_xs, batch_ts = mnist.train.next_batch(100)
#勾配降下法によってパラメータの修正を行う
    sess.run(train_step, feed_dict={x: batch_xs, t: batch_ts})
    if i % 100 == 0:
        loss_val, acc_val = sess.run([loss, accuracy],
            feed_dict={x:mnist.test.images, t: mnist.test.labels})
        print ('Step: %d, Loss: %f, Accuracy: %f'
               % (i, loss_val, acc_val))

#得られた結果を実際の画像で確認する
images, labels = mnist.test.images, mnist.test.labels
p_val = sess.run(p, feed_dict={x:images, t: labels})

fig = plt.figure(figsize=(8,15))
for i in range(10):
    c = 1
    for (image, label, pred) in zip(images, labels, p_val):
        prediction, actual = np.argmax(pred), np.argmax(label)
        if prediction != i:
            continue
        if (c < 4 and i == actual) or (c >= 4 and i != actual):
            subplot = fig.add_subplot(10,6,i*6+c)
            subplot.set_xticks([])
            subplot.set_yticks([])
            subplot.set_title('%d / %d' % (prediction, actual))
            subplot.imshow(image.reshape((28,28)), vmin=0, vmax=1,
                           cmap=plt.cm.gray_r, interpolation="nearest")
            c += 1
            if c > 6:
                break
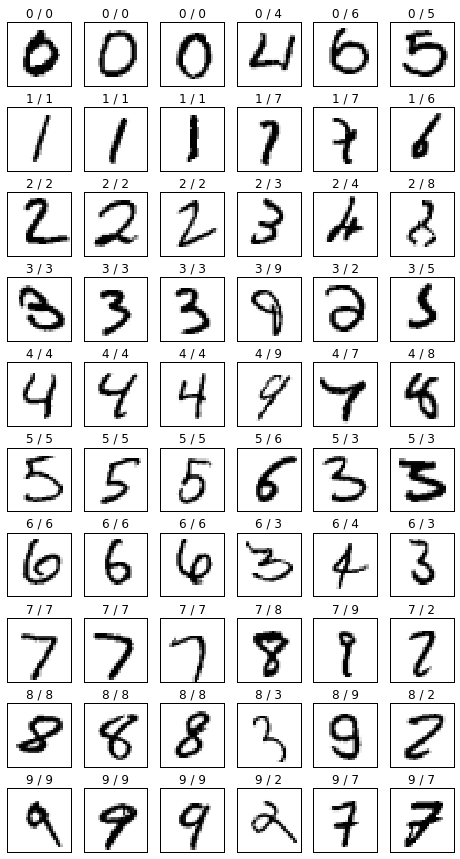
これを実行すると以下の結果が得られる。

画像の添字としてついている数字は左が予測と右が正解になる。0/0となっているのは正解で、0/4となっていたら不正解になる。
2.3.4 ミニバッチと確率的勾配降下法
上のコードでも用いているミニバッチによるパラメータ修正について。そもそも確率降下法とはパラメータ(w0,w1,...)の関数として、誤差関数E(w0,w1,...)が与えられた際に、Eの値が減少する方向にパラメータを修正していくという考えだった。 この時、Eの値が減少する方向は次の勾配ベクトルで決まるのだった。
ここで、誤差関数(2.41)式を見ると、トレーニングセットのそれぞれのデータについて和を取る形になっている。つまり、次のようにn番目のデータに対する誤差Enの和の形に分解することが可能になる。
ここで、Enは
である。 この時、Placeholder xにトレーニングセットの一部のデータだけを格納したとすると、対応する誤差関数lossはどのようになるだろうか。これは(2.45)式においてxに格納したデータの部分だけEnを足すということになる。この状態でトレーニングをするということは誤差関数Eにおいて、一部のデータからの寄与だけを考えて、データによる誤差を小さくするようにパラメータを修正することになる。本来のE全体の値を小さくするわけではないので、誤差関数の谷を一直線に下るのではなく、少しだけ横にずれた方向に下ることになる。ただし、次の修正処理においては、また違うデータからの寄与を考慮する。これを何度も繰り返すと、誤差関数の谷をジグザグに降りながら、最終的には本来の最小値に近づいていくと考えられる。これがミニバッチの考え方だ。一直線に最小値に向かわず、ランダムに最小値に向かうので、確率的勾配降下法とも呼ばれる。
確率的勾配降下法を用いることの利点として、
- ミニバッチでは1回あたりのデータ量を減らして、最適化の処理を何度も繰り返すので、1回あたりの計算量を減らせる
- 最小値と極小値を持つような誤差関数の場合、極小値を避けて、真の最小値に達することができる
というものがある。これ以降、MNISTのデータセットを用いるコードでは、ミニバッチの最適化処理を適用する。